- Launch Fiddler
- Launch Qlik Sense Desktop
- Open a Qlik Sense app (it doesn't matter which)
- In Fiddler, hit "Ctrl-F" and search for "client.js", You should find a request for something like this: "http://localhost:4848/resources/assets/client/client.js??1403864013132". This is a key part of the Qlik Sense Desktop client logic. Look at the response in the Inspectors tab and select "View in Notepad". In Notepad, delete the first three lines and Save the file as "client.js" locally.
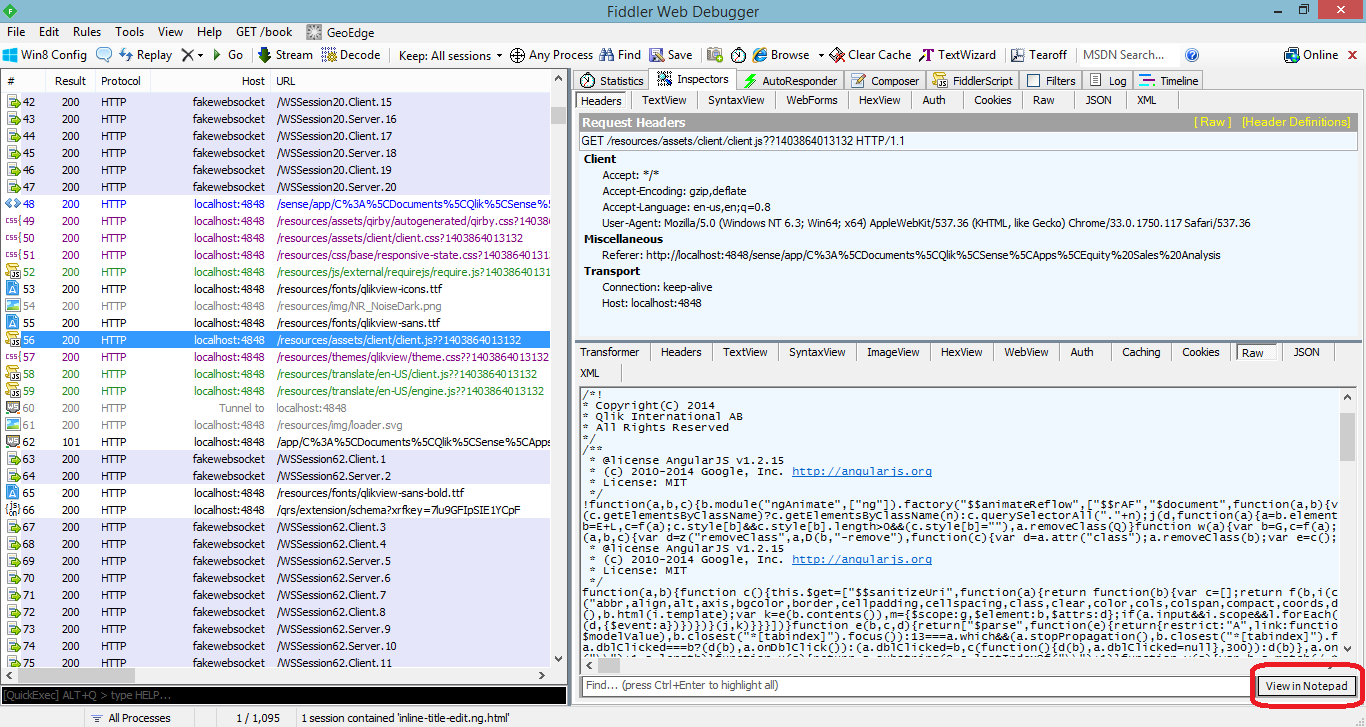
View client.js in Notepad - You'll notice that the JavaScript in "client.js" is not properly indented making in difficult to read. This is because the JavaScript has been minimised by removing whitespaces among other measures designed to optimise load speed. What you'll want to do at this stage is download and install the excellent Notepad++. Once you have Notepad++ installed and running go to Plugins > Plugin Manager > Show Plugin Manager, select "JSTool" under the "Available" tab and press "Install".
- Now open "client.js" in Notepad++, go to Plugins > JSTool and select "JSFormat". This should indent the JavaScript beautifully. Now save the file.
- With client.js still opened in Notepad++, select "Ctrl+F", search for "extensions.qliktech/barchart" and press the button "Find All in Current Document". You should see a few results including what appears to be a number of components that the built-in bar chart depends on (see screenshot below).

Bar chart components - Feel free to discover for yourself what makes up the built-in bar chart visualisation by reading through the code for each of the components listed above. For the purpose of this exercise however, I'll focus on the core bar chart definition labelled "extensions.qliktech/barchart/barchart" and port it as our own extension.
- Open the Workbench editor by pointing your browser to http://localhost:4848/workbencheditor", select the "New" button to create a new visualisation project and specify a project name like "My bar chart".
- In Notepad++, copy the contents of the bar chart definition labelled "extensions.qliktech/barchart/barchart" to the clipboard. (I'm including the code below for your convenience.)
define("extensions.qliktech/barchart/barchart", ["jquery", "util", "qvangular", "client.utils/state", "general.utils/property-resolver", "extensions.qliktech/barchart/bararea", "extensions.qliktech/barchart/barchart-properties", "objects.views/charts/scrollable-chart", "objects.views/charts/components/chart-component", "objects.views/charts/components/grid", "objects.views/charts/components/axis/discrete-axis", "objects.views/charts/representation/combo-color-map", "objects.views/charts/utils/binding", "objects.views/charts/chart-data-helper", "objects.backend-api/pivot-api", "objects.utils/shapes/rect", "text!./barchart.ng.html", "objects.extension/object-conversion"], function (a, b, c, d, e, f, g, h, i, j, k, l, m, n, o, p, q, r) { function s(a, b, c, d, e, f) { var g, h = ["bottom", "top"], i = ["left", "right"]; "horizontal" === f ? (g = h, h = i, i = g, d.setDock("right")) : d.setDock("bottom"), a.setDock("far" === e.dimensionAxis.dock ? h[1] : h[0]), b.setDock("far" === e.dimensionAxis.dock ? h[1] : h[0]), c.setDock("far" === e.measureAxis.dock ? i[1] : i[0]) } var t, u, v = 500, w = { NONE : 0, ONE_DIM : 1, TWO_DIM : 2 }; return t = h.extend("BarChart", { namespace : ".barchart", init : function (b, c, d, e) { var g, h = a.extend(!0, {}, d); this.$scope = b, d = a.extend(!0, d || {}, { components : { dataArea : { clazz : f }, miniChart : { components : { dataArea : { clazz : f } } } } }, h), this._super(b, c, d, e), this._data = {}, this._tree = null, this.components.dimensionAxis.setMaxDiscreteUnitSize(64), g = this.components.miniChart, this.components.miniChart && (this.components.miniChart.setBackendApi(this.backendApi), this.components.scrollArea.setUseMiniChart(!0), g.components.measureAxis.setDock("left"), g.components.dimensionAxis.setDock("bottom"), g.components.dataArea.setMinorAxis(g.components.measureAxis), g.components.dataArea.setMajorAxis(g.components.dimensionAxis), g.components.dataArea.setShowDataPoints(!1), g.setColorMap(this.providers.colorMap)), this._orientation = "vertical" }, initSelections : function () { this.selections.Select.bind(function (a, b) { var c = [0]; this.selections._activeType.components.dataArea ? c = this.components.dataArea.getSelectionIndices() || [0] : this.selections._activeType.components.legend && (c = this.components.legend.getSelectionIndices()), this.onSelection.Select.apply(this, [a, b, c, "L"]) } .bind(this)), this._super() }, _paint : function () { if (this._super() === !1) return !1; var a, b = this._data, c = this.components.scrollArea, d = this.getSnapshotStoredChartData(), e = "vertical" === b.orientation ? this.rect.height : this.rect.width, f = 0; if (this._cutMode ? ((this._cutMode.positive || this._cutMode.negative) && (this._layoutMode >= 31 && (f = 48), f = this._layoutMode >= 15 ? 32 : this._layoutMode >= 7 ? 16 : 8), "vertical" === b.orientation ? this.components.measureAxis.setPadding(this._cutMode.positive ? f : 0, 0, this._cutMode.negative ? f : 0, 0) : this.components.measureAxis.setPadding(0, this._cutMode.positive ? f : 0, 0, this._cutMode.negative ? f : 0)) : this.components.measureAxis.setPadding(0, 0, 0, 0), this.components.dimensionAxis.setMaxDiscreteUnitSize(Math.max(1, Math.ceil(e / 4))), this.components.dimensionAxisTitle.setFont(this.components.dimensionAxis._style.title.font), this.layout(), this._readStoredData && (this.components.dimensionAxis.setInnerOffset(d.axisInnerOffset), this.components.scrollArea.setOffset(d.scrollOffset)), !this.checkPage()) { for (a in this.components) this.components[a].invalidateDisplay("BarChart.paint"); c.viewState.min + c.viewState.range > c.fullState.max && c.setOffset(c.fullState.max - c.viewState.range) } }, prePaint : function () {}, _updateData : function (a) { this._checkPage = !1, this._disablePagingTransitions.call(this), this._data = a, this.isStacked = "stacked" === a.barGrouping.grouping && (a.qHyperCube.qDimensionInfo.length > 1 || a.qHyperCube.qMeasureInfo.length > 1), this.components.measureAxis.isStacked = this.isStacked, this.components.scrollArea.setUseMiniChart(!0), this.components.dataArea.setData(a), this.providers.colorMap.setData(a), this.components.legend.setData(a), this.components.dimensionAxisTitle.setData(a), a.orientation && this.components.miniChart ? (this._orientation !== a.orientation && (this.components.miniChart.clear(), this._orientation = a.orientation), this.components.miniChart.setOrientation(a.orientation), this.components.scrollArea.setMiniChart(this.components.miniChart)) : this._orientation = a.orientation, this.components.scrollArea.getUseMiniChart() && this.components.miniChart && this.components.miniChart.setData(a); var b = { axes : { measureAxis : { component : this.components.measureAxis }, dimensionAxis : { component : this.components.dimensionAxis } }, axisTitles : { dimensionAxisTitle : { component : this.components.dimensionAxisTitle } }, refLineLabels : { labels : { data : a.refLine.refLines, component : this.components.refLineLabels } }, refLines : { component : this.components.refLines } }, c = null, d = this.getSnapshotStoredChartData(); this.scrollMultiplicator = 1, this._pagingMode = w.NONE, this.components.dataArea._allowInnerSelection = !1, a.qHyperCube.qDimensionInfo.length < 2 && a.qHyperCube.qSize.qcy > v ? (c = a.qHyperCube.qSize.qcy, "grouped" === a.barGrouping.grouping && a.qHyperCube.qMeasureInfo.length > 1 && (this.scrollMultiplicator = a.qHyperCube.qMeasureInfo.length + 1, c *= this.scrollMultiplicator), this._pagingMode = w.ONE_DIM) : a.qHyperCube.qDimensionInfo.length > 1 && "grouped" === a.barGrouping.grouping ? (a.qHyperCube.qSize.qcy > v && (this._pagingMode = w.TWO_DIM, c = a.qHyperCube.qSize.qcy), this.components.dataArea._allowInnerSelection = a.qHyperCube.qDimensionInfo[0].qStateCounts.qOption + a.qHyperCube.qDimensionInfo[0].qStateCounts.qSelected <= 1) : a.qHyperCube.qDimensionInfo.length > 1 && (this.components.dataArea._allowInnerSelection = a.qHyperCube.qDimensionInfo[0].qStateCounts.qOption + a.qHyperCube.qDimensionInfo[0].qStateCounts.qSelected <= 1, c = this.isStacked ? a.qHyperCube.qStackedDataPages && a.qHyperCube.qStackedDataPages.length ? Math.max(a.qHyperCube.qDimensionInfo[0].qStateCounts.qOption + a.qHyperCube.qDimensionInfo[0].qStateCounts.qSelected, a.qHyperCube.qStackedDataPages[0].qData[0].qSubNodes.length) : a.qHyperCube.qDimensionInfo[0].qStateCounts.qOption + a.qHyperCube.qDimensionInfo[0].qStateCounts.qSelected : a.qHyperCube.qDataPages[0].qMatrix.length + a.qHyperCube.qDimensionInfo[0].qStateCounts.qOption + a.qHyperCube.qDimensionInfo[0].qStateCounts.qSelected, this._pagingMode = w.ONE_DIM), this.components.dimensionAxis.isDiscrete() || (this._pagingMode = w.NONE), this.components.dimensionAxis.setNumDiscreteUnits(c), this._super(a, b), this._readStoredData ? (this.components.dimensionAxis.setInnerOffset(d.axisInnerOffset), this.components.scrollArea.setOffset(d.scrollOffset)) : (this.components.dimensionAxis.setInnerOffset(0), this.components.scrollArea.setOffset(0)), this._checkPage = !0 }, updateDataArea : function (a) { this.components.dataArea.setShowDataPoints(a.dataPoint.showLabels), this.components.dataArea.setGroupingMode(a.barGrouping.grouping), this.components.miniChart && this.components.miniChart.components.dataArea.setGroupingMode(a.barGrouping.grouping), this.components.dataArea.updateNow(["properties"]) }, updateAxis : function (c, e) { var f, g, h, i, j, k, l, m, n, o, p, q, r, t = c.qHyperCube.qMeasureInfo.filter(function (a) { return !isNaN(a.qMin) }).map(function (a) { return { min : a.qMin, max : a.qMax, index : c.qHyperCube.qMeasureInfo.indexOf(a) } }); n = t.reduce(function (a, b) { return a.min < b.min ? a : b }, t[0]), o = t.reduce(function (a, b) { return a.max > b.max ? a : b }, t[0]), p = n ? n.min : u, q = o ? o.max : u, b.isNumeric(p) || (p = 0), b.isNumeric(q) || (q = 1), f = this.components.measureAxis, g = this.components.dimensionAxis, h = this.components.dimensionAxisTitle; var v = this.components.dataArea.getMajorAxisData(), w = this.components.dataArea.getMinorAxisData(); g.setDataRange(v.data, v.info), g.setGroupSize(v.groupSize), k = c.qHyperCube.qMeasureInfo.map(function (a) { return a.qFallbackTitle }).join(", "), l = c.qHyperCube.qDimensionInfo.map(function (a) { return a.qFallbackTitle }).join(", "), d.view !== d.Views.story ? (h.setTitle(l), h.showComponent()) : h.hideComponent(), a.extend(e.axes.measureAxis, { data : c.measureAxis, title : k, dataIndices : c.qHyperCube.qMeasureInfo.map(function (a, b) { return b }) }), a.extend(e.axes.dimensionAxis, { data : c.dimensionAxis, title : d.view !== d.Views.story ? "" : l, dataIndices : c.qHyperCube.qDimensionInfo.map(function (a, b) { return b }), currentDataIndices : [0] }), a.extend(e.axisTitles.dimensionAxisTitle, { data : c.dimensionAxis, title : d.view !== d.Views.story ? "" : l }), m = e.axes.measureAxis, r = this.getAxisOptions(m), e.refLineLabels.labels.axis = f, s.apply(this, [g, h, f, this.components.scrollArea, c, this._orientation]), this._super(c, e); for (j in e.axes) i = e.axes[j], i.component.setDataIndices(i.dataIndices || [i.dataIndex || 0]), i.component.setCurrentDataIndices(i.currentDataIndices || i.dataIndices || [i.dataIndex || 0]); p > q ? (q = 10, p = -10) : p === q && 0 === q && (q = 10, p = -10), q = Math.max(0, q), p = Math.min(0, p), n && o ? (this._cutMode = this.getSpikeSettings(c, n, o, p, q, r), q = this._cutMode.max, p = this._cutMode.min) : this._cutMode = { positive : !1, negative : !1 }, w ? this.setAxisDataRange(f, w.max, w.min, r.max, r.min, 1) : this.setAxisDataRange(f, q, p, r.max, r.min, 1), g.setUnitAlignment("none" === c.measureAxis.show ? "center" : ["near", "far"].contains(c.measureAxis.dock) ? g.isHorizontal() ? c.measureAxis.dock : "near" === c.measureAxis.dock ? "far" : "near" : g.isHorizontal() ? "left" === c.measureAxis.dock ? "near" : "far" : "bottom" === c.measureAxis.dock ? "far" : "near") }, getSpikeSettings : function (a, b, c, d, e, f) { for (var g, h, i = 0, j = 0, k = 0, l = 0, m = !1, n = !1, o = c.index + a.qHyperCube.qDimensionInfo.length, p = b.index + a.qHyperCube.qDimensionInfo.length, q = a.qHyperCube.qDataPages[0] ? a.qHyperCube.qDataPages[0].qMatrix : [], r = 0; r < q.length; r++) g = q[r], h = g[o].qNum, 0 >= h || isNaN(h) || (g[0].qIsOtherCell || g[1].qIsOtherCell ? k = Math.max(h, k) : i = Math.max(h, i), h = g[p].qNum, h >= 0 || (g[0].qIsOtherCell || g[1].qIsOtherCell ? l = Math.min(h, l) : j = Math.min(h, j))); return this.isStacked && a.qHyperCube.qMeasureInfo.length + a.qHyperCube.qDimensionInfo.length > 2 || (null !== f.max && f.max < e ? m = f.max > 0 : i > 0 && k / i > 5 ? (e = i, m = e >= 0) : 0 === i && k > 10 && (e = 1, m = e >= 0), null !== f.min && f.min > d ? n = f.min < 0 : 0 > j && l / j > 5 ? (d = j, n = 0 > d) : 0 === j && -10 > l && (d = -1, n = 0 > d)), { max : e, min : d, positive : m, negative : n } }, release : function () { this._super() }, setOrientation : function (a) { this._orientation = a || "horizontal" }, getOrientation : function () { return this._orientation }, getContextMenu : function (a, b) { var c = a.model; d.state === d.States.edit && (a.isReadonly || b.addItem({ translation : "contextMenu.flip" }).Activated.bind(function () { c.getProperties().then(function (a) { a.orientation = "horizontal" === a.orientation ? "vertical" : "horizontal", c.save() }) })) } }), { type : "barchart", BackendApi : o, template : q, View : t, definition : g, initialProperties : { version : .96, qHyperCubeDef : { qDimensions : [], qMeasures : [], qMode : "S", qPseudoDimPos : 1e4, qAlwaysFullyExpanded : !0, qInitialDataFetch : [{ qTop : 0, qHeight : v, qLeft : 0, qWidth : 17 } ], qSuppressZero : !1, qSuppressMissing : !0 } }, snapshot : { canTakeSnapshot : !0 }, options : { selections : { dataArea : {}, tooltip : {}, range : {}, legend : {} } }, importProperties : function (a, b, c) { var d = r.axisChart.importProperties.apply(r, [a, b, c]), e = d.qProperty; return e.qHyperCubeDef.qDimensions.length > 1 && "stacked" === e.barGrouping.grouping && (e.qHyperCubeDef.qMode = "K"), d } .bind(r), exportProperties : r.axisChart.exportProperties.bind(r) } }) - In workbench, select your custom extension project's JavaScript file, delete all content, paste the code you've just copied to your clipboard and modify the first line as follows:
This simply removes the characters ""extensions.qliktech/barchart/barchart" and replaces the characters "text!./barchart.ng.html" with "text!extensions.qliktech/barchart/barchart.ng.html" as the barchart.ng.html template is only local to the original built-in bar chart, not local to our custom bar chart extension.define(["jquery", "util", "qvangular", "client.utils/state", "general.utils/property-resolver", "extensions.qliktech/barchart/bararea", "extensions.qliktech/barchart/barchart-properties", "objects.views/charts/scrollable-chart", "objects.views/charts/components/chart-component", "objects.views/charts/components/grid", "objects.views/charts/components/axis/discrete-axis", "objects.views/charts/representation/combo-color-map", "objects.views/charts/utils/binding", "objects.views/charts/chart-data-helper", "objects.backend-api/pivot-api", "objects.utils/shapes/rect", "text!extensions.qliktech/barchart/barchart.ng.html", "objects.extension/object-conversion"], function (a, b, c, d, e, f, g, h, i, j, k, l, m, n, o, p, q, r) { - Don't forget to edit your project's QEXT file and specify a unique name for your extension such as "My bar chart".
- That's it, you should now be able to use this extension in your app. When you do, it should look exactly like the built-in bar chart but you now have it under your control to tweak as you wish.
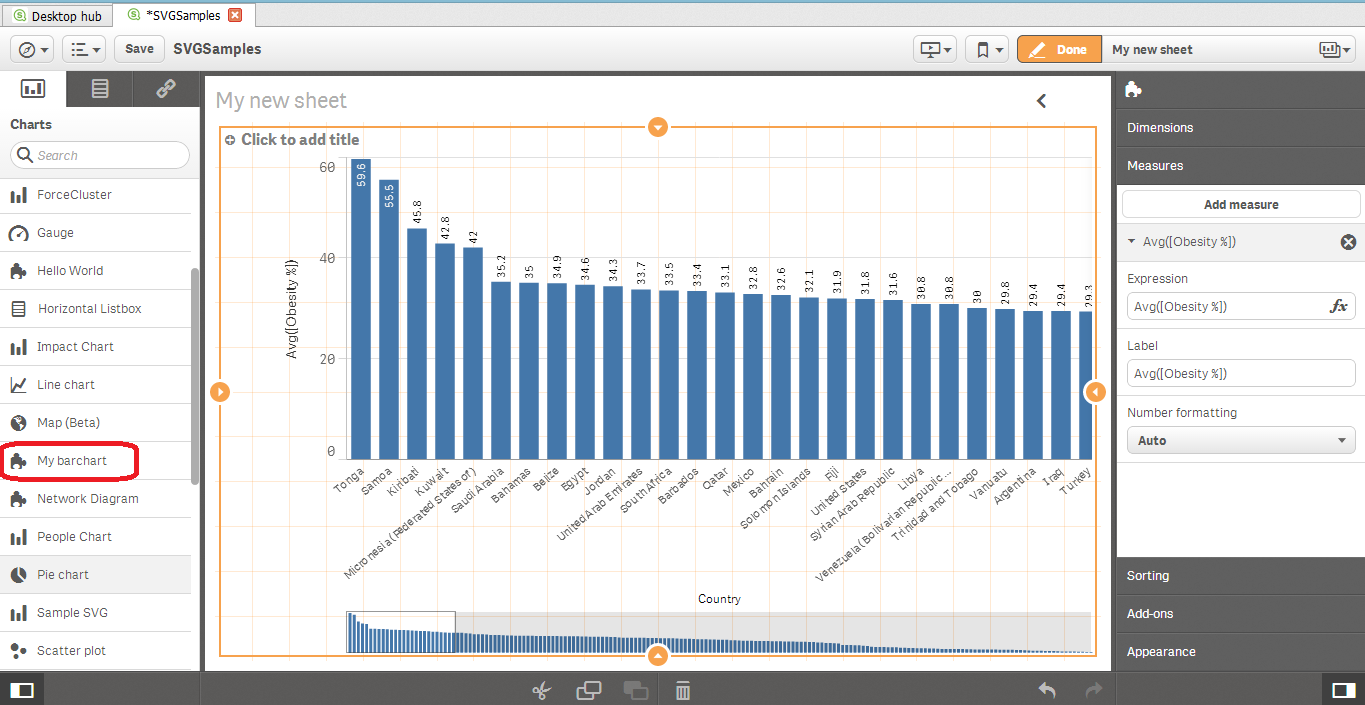
An extension based on the built-in bar chart
Wednesday, 10 September 2014
Extending built-in Qlik Sense visualisations
Visualisations built into Qlik Sense Desktop (such as the bar chart) are built on the same principle as visualisation extensions created in Workbench.This is great news as it means that there should be a way to extend built-in visualisations rather than having to build your own version of, say, the bar chart from scratch. To find out how to do this, let's fire up our trusty Fiddler (see my previous post for more details on Fiddler) and follow the steps below.
Subscribe to:
Post Comments (Atom)
No comments:
Post a Comment