In Notepad++, copy the contents of the bar chart definition labelled "extensions.qliktech/barchart/barchart" to the clipboard. (I'm including the code below for your convenience.) define("extensions.qliktech/barchart/barchart", ["jquery", "util", "qvangular", "client.utils/state", "general.utils/property-resolver", "extensions.qliktech/barchart/bararea", "extensions.qliktech/barchart/barchart-properties", "objects.views/charts/scrollable-chart", "objects.views/charts/components/chart-component", "objects.views/charts/components/grid", "objects.views/charts/components/axis/discrete-axis", "objects.views/charts/representation/combo-color-map", "objects.views/charts/utils/binding", "objects.views/charts/chart-data-helper", "objects.backend-api/pivot-api", "objects.utils/shapes/rect", "text!./barchart.ng.html", "objects.extension/object-conversion"], function (a, b, c, d, e, f, g, h, i, j, k, l, m, n, o, p, q, r) {
function s(a, b, c, d, e, f) {
var g,
h = ["bottom", "top"],
i = ["left", "right"];
"horizontal" === f ? (g = h, h = i, i = g, d.setDock("right")) : d.setDock("bottom"),
a.setDock("far" === e.dimensionAxis.dock ? h[1] : h[0]),
b.setDock("far" === e.dimensionAxis.dock ? h[1] : h[0]),
c.setDock("far" === e.measureAxis.dock ? i[1] : i[0])
}
var t,
u,
v = 500,
w = {
NONE : 0,
ONE_DIM : 1,
TWO_DIM : 2
};
return t = h.extend("BarChart", {
namespace : ".barchart",
init : function (b, c, d, e) {
var g,
h = a.extend(!0, {}, d);
this.$scope = b,
d = a.extend(!0, d || {}, {
components : {
dataArea : {
clazz : f
},
miniChart : {
components : {
dataArea : {
clazz : f
}
}
}
}
}, h),
this._super(b, c, d, e),
this._data = {},
this._tree = null,
this.components.dimensionAxis.setMaxDiscreteUnitSize(64),
g = this.components.miniChart,
this.components.miniChart && (this.components.miniChart.setBackendApi(this.backendApi), this.components.scrollArea.setUseMiniChart(!0), g.components.measureAxis.setDock("left"), g.components.dimensionAxis.setDock("bottom"), g.components.dataArea.setMinorAxis(g.components.measureAxis), g.components.dataArea.setMajorAxis(g.components.dimensionAxis), g.components.dataArea.setShowDataPoints(!1), g.setColorMap(this.providers.colorMap)),
this._orientation = "vertical"
},
initSelections : function () {
this.selections.Select.bind(function (a, b) {
var c = [0];
this.selections._activeType.components.dataArea ? c = this.components.dataArea.getSelectionIndices() || [0] : this.selections._activeType.components.legend && (c = this.components.legend.getSelectionIndices()),
this.onSelection.Select.apply(this, [a, b, c, "L"])
}
.bind(this)),
this._super()
},
_paint : function () {
if (this._super() === !1)
return !1;
var a,
b = this._data,
c = this.components.scrollArea,
d = this.getSnapshotStoredChartData(),
e = "vertical" === b.orientation ? this.rect.height : this.rect.width,
f = 0;
if (this._cutMode ? ((this._cutMode.positive || this._cutMode.negative) && (this._layoutMode >= 31 && (f = 48), f = this._layoutMode >= 15 ? 32 : this._layoutMode >= 7 ? 16 : 8), "vertical" === b.orientation ? this.components.measureAxis.setPadding(this._cutMode.positive ? f : 0, 0, this._cutMode.negative ? f : 0, 0) : this.components.measureAxis.setPadding(0, this._cutMode.positive ? f : 0, 0, this._cutMode.negative ? f : 0)) : this.components.measureAxis.setPadding(0, 0, 0, 0), this.components.dimensionAxis.setMaxDiscreteUnitSize(Math.max(1, Math.ceil(e / 4))), this.components.dimensionAxisTitle.setFont(this.components.dimensionAxis._style.title.font), this.layout(), this._readStoredData && (this.components.dimensionAxis.setInnerOffset(d.axisInnerOffset), this.components.scrollArea.setOffset(d.scrollOffset)), !this.checkPage()) {
for (a in this.components)
this.components[a].invalidateDisplay("BarChart.paint");
c.viewState.min + c.viewState.range > c.fullState.max && c.setOffset(c.fullState.max - c.viewState.range)
}
},
prePaint : function () {},
_updateData : function (a) {
this._checkPage = !1,
this._disablePagingTransitions.call(this),
this._data = a,
this.isStacked = "stacked" === a.barGrouping.grouping && (a.qHyperCube.qDimensionInfo.length > 1 || a.qHyperCube.qMeasureInfo.length > 1),
this.components.measureAxis.isStacked = this.isStacked,
this.components.scrollArea.setUseMiniChart(!0),
this.components.dataArea.setData(a),
this.providers.colorMap.setData(a),
this.components.legend.setData(a),
this.components.dimensionAxisTitle.setData(a),
a.orientation && this.components.miniChart ? (this._orientation !== a.orientation && (this.components.miniChart.clear(), this._orientation = a.orientation), this.components.miniChart.setOrientation(a.orientation), this.components.scrollArea.setMiniChart(this.components.miniChart)) : this._orientation = a.orientation,
this.components.scrollArea.getUseMiniChart() && this.components.miniChart && this.components.miniChart.setData(a);
var b = {
axes : {
measureAxis : {
component : this.components.measureAxis
},
dimensionAxis : {
component : this.components.dimensionAxis
}
},
axisTitles : {
dimensionAxisTitle : {
component : this.components.dimensionAxisTitle
}
},
refLineLabels : {
labels : {
data : a.refLine.refLines,
component : this.components.refLineLabels
}
},
refLines : {
component : this.components.refLines
}
},
c = null,
d = this.getSnapshotStoredChartData();
this.scrollMultiplicator = 1,
this._pagingMode = w.NONE,
this.components.dataArea._allowInnerSelection = !1,
a.qHyperCube.qDimensionInfo.length < 2 && a.qHyperCube.qSize.qcy > v ? (c = a.qHyperCube.qSize.qcy, "grouped" === a.barGrouping.grouping && a.qHyperCube.qMeasureInfo.length > 1 && (this.scrollMultiplicator = a.qHyperCube.qMeasureInfo.length + 1, c *= this.scrollMultiplicator), this._pagingMode = w.ONE_DIM) : a.qHyperCube.qDimensionInfo.length > 1 && "grouped" === a.barGrouping.grouping ? (a.qHyperCube.qSize.qcy > v && (this._pagingMode = w.TWO_DIM, c = a.qHyperCube.qSize.qcy), this.components.dataArea._allowInnerSelection = a.qHyperCube.qDimensionInfo[0].qStateCounts.qOption + a.qHyperCube.qDimensionInfo[0].qStateCounts.qSelected <= 1) : a.qHyperCube.qDimensionInfo.length > 1 && (this.components.dataArea._allowInnerSelection = a.qHyperCube.qDimensionInfo[0].qStateCounts.qOption + a.qHyperCube.qDimensionInfo[0].qStateCounts.qSelected <= 1, c = this.isStacked ? a.qHyperCube.qStackedDataPages && a.qHyperCube.qStackedDataPages.length ? Math.max(a.qHyperCube.qDimensionInfo[0].qStateCounts.qOption + a.qHyperCube.qDimensionInfo[0].qStateCounts.qSelected, a.qHyperCube.qStackedDataPages[0].qData[0].qSubNodes.length) : a.qHyperCube.qDimensionInfo[0].qStateCounts.qOption + a.qHyperCube.qDimensionInfo[0].qStateCounts.qSelected : a.qHyperCube.qDataPages[0].qMatrix.length + a.qHyperCube.qDimensionInfo[0].qStateCounts.qOption + a.qHyperCube.qDimensionInfo[0].qStateCounts.qSelected, this._pagingMode = w.ONE_DIM),
this.components.dimensionAxis.isDiscrete() || (this._pagingMode = w.NONE),
this.components.dimensionAxis.setNumDiscreteUnits(c),
this._super(a, b),
this._readStoredData ? (this.components.dimensionAxis.setInnerOffset(d.axisInnerOffset), this.components.scrollArea.setOffset(d.scrollOffset)) : (this.components.dimensionAxis.setInnerOffset(0), this.components.scrollArea.setOffset(0)),
this._checkPage = !0
},
updateDataArea : function (a) {
this.components.dataArea.setShowDataPoints(a.dataPoint.showLabels),
this.components.dataArea.setGroupingMode(a.barGrouping.grouping),
this.components.miniChart && this.components.miniChart.components.dataArea.setGroupingMode(a.barGrouping.grouping),
this.components.dataArea.updateNow(["properties"])
},
updateAxis : function (c, e) {
var f,
g,
h,
i,
j,
k,
l,
m,
n,
o,
p,
q,
r,
t = c.qHyperCube.qMeasureInfo.filter(function (a) {
return !isNaN(a.qMin)
}).map(function (a) {
return {
min : a.qMin,
max : a.qMax,
index : c.qHyperCube.qMeasureInfo.indexOf(a)
}
});
n = t.reduce(function (a, b) {
return a.min < b.min ? a : b
}, t[0]),
o = t.reduce(function (a, b) {
return a.max > b.max ? a : b
}, t[0]),
p = n ? n.min : u,
q = o ? o.max : u,
b.isNumeric(p) || (p = 0),
b.isNumeric(q) || (q = 1),
f = this.components.measureAxis,
g = this.components.dimensionAxis,
h = this.components.dimensionAxisTitle;
var v = this.components.dataArea.getMajorAxisData(),
w = this.components.dataArea.getMinorAxisData();
g.setDataRange(v.data, v.info),
g.setGroupSize(v.groupSize),
k = c.qHyperCube.qMeasureInfo.map(function (a) {
return a.qFallbackTitle
}).join(", "),
l = c.qHyperCube.qDimensionInfo.map(function (a) {
return a.qFallbackTitle
}).join(", "),
d.view !== d.Views.story ? (h.setTitle(l), h.showComponent()) : h.hideComponent(),
a.extend(e.axes.measureAxis, {
data : c.measureAxis,
title : k,
dataIndices : c.qHyperCube.qMeasureInfo.map(function (a, b) {
return b
})
}),
a.extend(e.axes.dimensionAxis, {
data : c.dimensionAxis,
title : d.view !== d.Views.story ? "" : l,
dataIndices : c.qHyperCube.qDimensionInfo.map(function (a, b) {
return b
}),
currentDataIndices : [0]
}),
a.extend(e.axisTitles.dimensionAxisTitle, {
data : c.dimensionAxis,
title : d.view !== d.Views.story ? "" : l
}),
m = e.axes.measureAxis,
r = this.getAxisOptions(m),
e.refLineLabels.labels.axis = f,
s.apply(this, [g, h, f, this.components.scrollArea, c, this._orientation]),
this._super(c, e);
for (j in e.axes)
i = e.axes[j], i.component.setDataIndices(i.dataIndices || [i.dataIndex || 0]), i.component.setCurrentDataIndices(i.currentDataIndices || i.dataIndices || [i.dataIndex || 0]);
p > q ? (q = 10, p = -10) : p === q && 0 === q && (q = 10, p = -10),
q = Math.max(0, q),
p = Math.min(0, p),
n && o ? (this._cutMode = this.getSpikeSettings(c, n, o, p, q, r), q = this._cutMode.max, p = this._cutMode.min) : this._cutMode = {
positive : !1,
negative : !1
},
w ? this.setAxisDataRange(f, w.max, w.min, r.max, r.min, 1) : this.setAxisDataRange(f, q, p, r.max, r.min, 1),
g.setUnitAlignment("none" === c.measureAxis.show ? "center" : ["near", "far"].contains(c.measureAxis.dock) ? g.isHorizontal() ? c.measureAxis.dock : "near" === c.measureAxis.dock ? "far" : "near" : g.isHorizontal() ? "left" === c.measureAxis.dock ? "near" : "far" : "bottom" === c.measureAxis.dock ? "far" : "near")
},
getSpikeSettings : function (a, b, c, d, e, f) {
for (var g, h, i = 0, j = 0, k = 0, l = 0, m = !1, n = !1, o = c.index + a.qHyperCube.qDimensionInfo.length, p = b.index + a.qHyperCube.qDimensionInfo.length, q = a.qHyperCube.qDataPages[0] ? a.qHyperCube.qDataPages[0].qMatrix : [], r = 0; r < q.length; r++)
g = q[r], h = g[o].qNum, 0 >= h || isNaN(h) || (g[0].qIsOtherCell || g[1].qIsOtherCell ? k = Math.max(h, k) : i = Math.max(h, i), h = g[p].qNum, h >= 0 || (g[0].qIsOtherCell || g[1].qIsOtherCell ? l = Math.min(h, l) : j = Math.min(h, j)));
return this.isStacked && a.qHyperCube.qMeasureInfo.length + a.qHyperCube.qDimensionInfo.length > 2 || (null !== f.max && f.max < e ? m = f.max > 0 : i > 0 && k / i > 5 ? (e = i, m = e >= 0) : 0 === i && k > 10 && (e = 1, m = e >= 0), null !== f.min && f.min > d ? n = f.min < 0 : 0 > j && l / j > 5 ? (d = j, n = 0 > d) : 0 === j && -10 > l && (d = -1, n = 0 > d)), {
max : e,
min : d,
positive : m,
negative : n
}
},
release : function () {
this._super()
},
setOrientation : function (a) {
this._orientation = a || "horizontal"
},
getOrientation : function () {
return this._orientation
},
getContextMenu : function (a, b) {
var c = a.model;
d.state === d.States.edit && (a.isReadonly || b.addItem({
translation : "contextMenu.flip"
}).Activated.bind(function () {
c.getProperties().then(function (a) {
a.orientation = "horizontal" === a.orientation ? "vertical" : "horizontal",
c.save()
})
}))
}
}), {
type : "barchart",
BackendApi : o,
template : q,
View : t,
definition : g,
initialProperties : {
version : .96,
qHyperCubeDef : {
qDimensions : [],
qMeasures : [],
qMode : "S",
qPseudoDimPos : 1e4,
qAlwaysFullyExpanded : !0,
qInitialDataFetch : [{
qTop : 0,
qHeight : v,
qLeft : 0,
qWidth : 17
}
],
qSuppressZero : !1,
qSuppressMissing : !0
}
},
snapshot : {
canTakeSnapshot : !0
},
options : {
selections : {
dataArea : {},
tooltip : {},
range : {},
legend : {}
}
},
importProperties : function (a, b, c) {
var d = r.axisChart.importProperties.apply(r, [a, b, c]),
e = d.qProperty;
return e.qHyperCubeDef.qDimensions.length > 1 && "stacked" === e.barGrouping.grouping && (e.qHyperCubeDef.qMode = "K"),
d
}
.bind(r),
exportProperties : r.axisChart.exportProperties.bind(r)
}
})




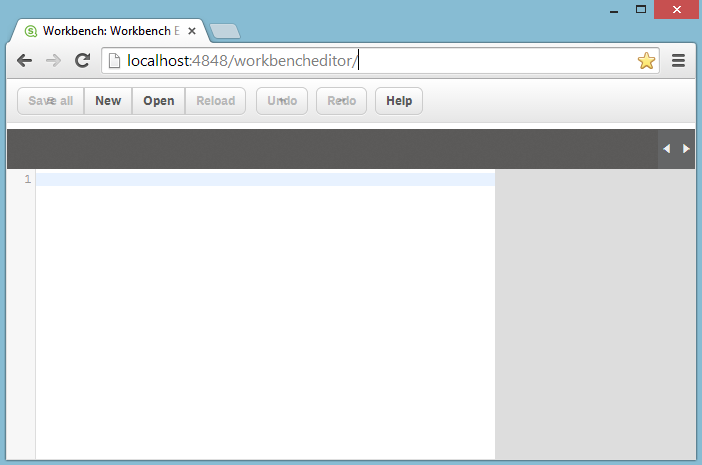

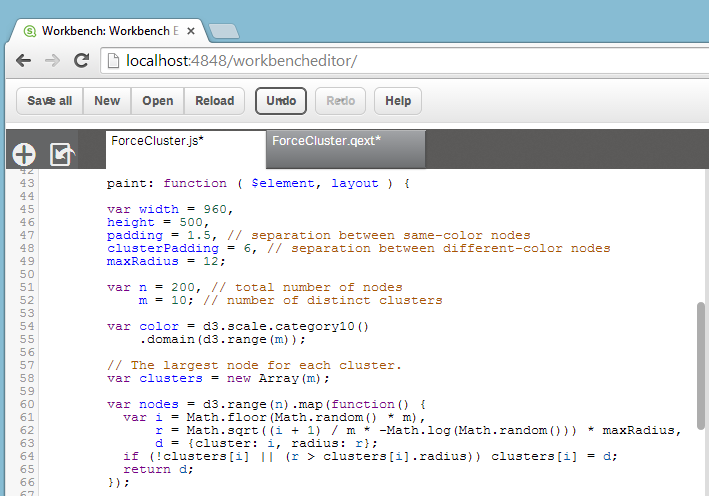
 ) situated in the top left hand area of Workbench and browsing to the file you've just saved.
