- Launch Fiddler
- Launch Qlik Sense Desktop
- Open a Qlik Sense app (it doesn't matter which)
- In Fiddler, hit "Ctrl-F" and search for "client.js", You should find a request for something like this: "http://localhost:4848/resources/assets/client/client.js??1403864013132". This is a key part of the Qlik Sense Desktop client logic. Look at the response in the Inspectors tab and select "View in Notepad". In Notepad, delete the first three lines and Save the file as "client.js" locally.
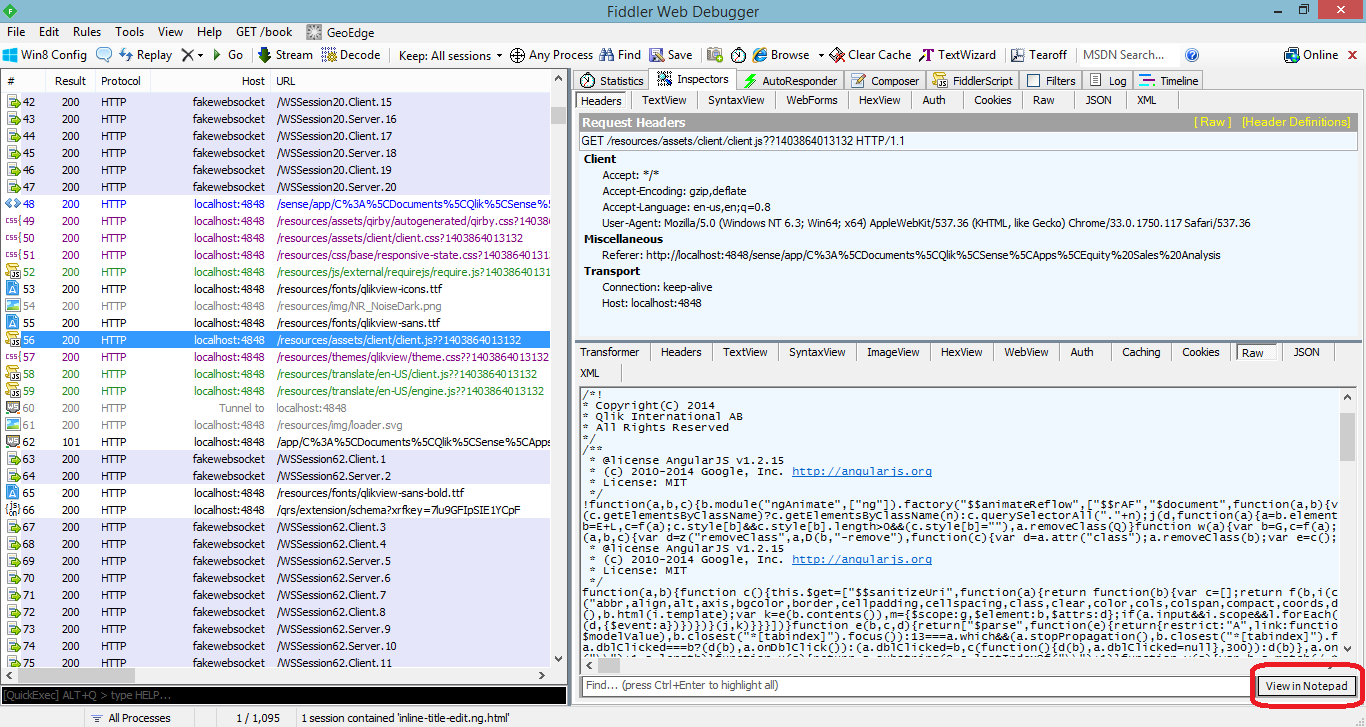
View client.js in Notepad - You'll notice that the JavaScript in "client.js" is not properly indented making in difficult to read. This is because the JavaScript has been minimised by removing whitespaces among other measures designed to optimise load speed. What you'll want to do at this stage is download and install the excellent Notepad++. Once you have Notepad++ installed and running go to Plugins > Plugin Manager > Show Plugin Manager, select "JSTool" under the "Available" tab and press "Install".
- Now open "client.js" in Notepad++, go to Plugins > JSTool and select "JSFormat". This should indent the JavaScript beautifully. Now save the file.
- With client.js still opened in Notepad++, select "Ctrl+F", search for "extensions.qliktech/barchart" and press the button "Find All in Current Document". You should see a few results including what appears to be a number of components that the built-in bar chart depends on (see screenshot below).

Bar chart components - Feel free to discover for yourself what makes up the built-in bar chart visualisation by reading through the code for each of the components listed above. For the purpose of this exercise however, I'll focus on the core bar chart definition labelled "extensions.qliktech/barchart/barchart" and port it as our own extension.
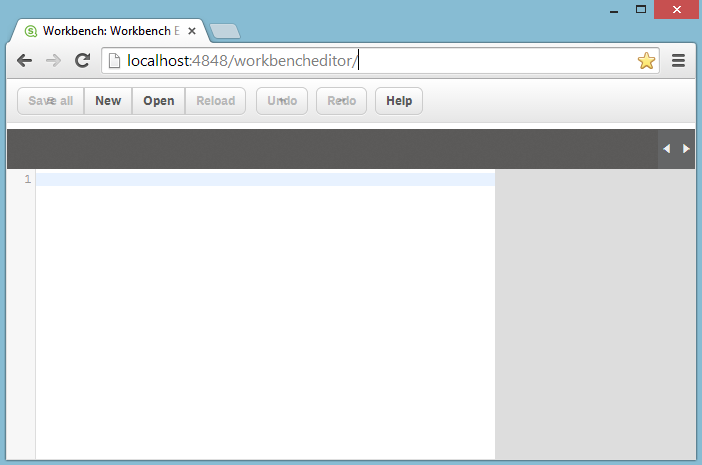
- Open the Workbench editor by pointing your browser to http://localhost:4848/workbencheditor", select the "New" button to create a new visualisation project and specify a project name like "My bar chart".
- In Notepad++, copy the contents of the bar chart definition labelled "extensions.qliktech/barchart/barchart" to the clipboard. (I'm including the code below for your convenience.)
define("extensions.qliktech/barchart/barchart", ["jquery", "util", "qvangular", "client.utils/state", "general.utils/property-resolver", "extensions.qliktech/barchart/bararea", "extensions.qliktech/barchart/barchart-properties", "objects.views/charts/scrollable-chart", "objects.views/charts/components/chart-component", "objects.views/charts/components/grid", "objects.views/charts/components/axis/discrete-axis", "objects.views/charts/representation/combo-color-map", "objects.views/charts/utils/binding", "objects.views/charts/chart-data-helper", "objects.backend-api/pivot-api", "objects.utils/shapes/rect", "text!./barchart.ng.html", "objects.extension/object-conversion"], function (a, b, c, d, e, f, g, h, i, j, k, l, m, n, o, p, q, r) { function s(a, b, c, d, e, f) { var g, h = ["bottom", "top"], i = ["left", "right"]; "horizontal" === f ? (g = h, h = i, i = g, d.setDock("right")) : d.setDock("bottom"), a.setDock("far" === e.dimensionAxis.dock ? h[1] : h[0]), b.setDock("far" === e.dimensionAxis.dock ? h[1] : h[0]), c.setDock("far" === e.measureAxis.dock ? i[1] : i[0]) } var t, u, v = 500, w = { NONE : 0, ONE_DIM : 1, TWO_DIM : 2 }; return t = h.extend("BarChart", { namespace : ".barchart", init : function (b, c, d, e) { var g, h = a.extend(!0, {}, d); this.$scope = b, d = a.extend(!0, d || {}, { components : { dataArea : { clazz : f }, miniChart : { components : { dataArea : { clazz : f } } } } }, h), this._super(b, c, d, e), this._data = {}, this._tree = null, this.components.dimensionAxis.setMaxDiscreteUnitSize(64), g = this.components.miniChart, this.components.miniChart && (this.components.miniChart.setBackendApi(this.backendApi), this.components.scrollArea.setUseMiniChart(!0), g.components.measureAxis.setDock("left"), g.components.dimensionAxis.setDock("bottom"), g.components.dataArea.setMinorAxis(g.components.measureAxis), g.components.dataArea.setMajorAxis(g.components.dimensionAxis), g.components.dataArea.setShowDataPoints(!1), g.setColorMap(this.providers.colorMap)), this._orientation = "vertical" }, initSelections : function () { this.selections.Select.bind(function (a, b) { var c = [0]; this.selections._activeType.components.dataArea ? c = this.components.dataArea.getSelectionIndices() || [0] : this.selections._activeType.components.legend && (c = this.components.legend.getSelectionIndices()), this.onSelection.Select.apply(this, [a, b, c, "L"]) } .bind(this)), this._super() }, _paint : function () { if (this._super() === !1) return !1; var a, b = this._data, c = this.components.scrollArea, d = this.getSnapshotStoredChartData(), e = "vertical" === b.orientation ? this.rect.height : this.rect.width, f = 0; if (this._cutMode ? ((this._cutMode.positive || this._cutMode.negative) && (this._layoutMode >= 31 && (f = 48), f = this._layoutMode >= 15 ? 32 : this._layoutMode >= 7 ? 16 : 8), "vertical" === b.orientation ? this.components.measureAxis.setPadding(this._cutMode.positive ? f : 0, 0, this._cutMode.negative ? f : 0, 0) : this.components.measureAxis.setPadding(0, this._cutMode.positive ? f : 0, 0, this._cutMode.negative ? f : 0)) : this.components.measureAxis.setPadding(0, 0, 0, 0), this.components.dimensionAxis.setMaxDiscreteUnitSize(Math.max(1, Math.ceil(e / 4))), this.components.dimensionAxisTitle.setFont(this.components.dimensionAxis._style.title.font), this.layout(), this._readStoredData && (this.components.dimensionAxis.setInnerOffset(d.axisInnerOffset), this.components.scrollArea.setOffset(d.scrollOffset)), !this.checkPage()) { for (a in this.components) this.components[a].invalidateDisplay("BarChart.paint"); c.viewState.min + c.viewState.range > c.fullState.max && c.setOffset(c.fullState.max - c.viewState.range) } }, prePaint : function () {}, _updateData : function (a) { this._checkPage = !1, this._disablePagingTransitions.call(this), this._data = a, this.isStacked = "stacked" === a.barGrouping.grouping && (a.qHyperCube.qDimensionInfo.length > 1 || a.qHyperCube.qMeasureInfo.length > 1), this.components.measureAxis.isStacked = this.isStacked, this.components.scrollArea.setUseMiniChart(!0), this.components.dataArea.setData(a), this.providers.colorMap.setData(a), this.components.legend.setData(a), this.components.dimensionAxisTitle.setData(a), a.orientation && this.components.miniChart ? (this._orientation !== a.orientation && (this.components.miniChart.clear(), this._orientation = a.orientation), this.components.miniChart.setOrientation(a.orientation), this.components.scrollArea.setMiniChart(this.components.miniChart)) : this._orientation = a.orientation, this.components.scrollArea.getUseMiniChart() && this.components.miniChart && this.components.miniChart.setData(a); var b = { axes : { measureAxis : { component : this.components.measureAxis }, dimensionAxis : { component : this.components.dimensionAxis } }, axisTitles : { dimensionAxisTitle : { component : this.components.dimensionAxisTitle } }, refLineLabels : { labels : { data : a.refLine.refLines, component : this.components.refLineLabels } }, refLines : { component : this.components.refLines } }, c = null, d = this.getSnapshotStoredChartData(); this.scrollMultiplicator = 1, this._pagingMode = w.NONE, this.components.dataArea._allowInnerSelection = !1, a.qHyperCube.qDimensionInfo.length < 2 && a.qHyperCube.qSize.qcy > v ? (c = a.qHyperCube.qSize.qcy, "grouped" === a.barGrouping.grouping && a.qHyperCube.qMeasureInfo.length > 1 && (this.scrollMultiplicator = a.qHyperCube.qMeasureInfo.length + 1, c *= this.scrollMultiplicator), this._pagingMode = w.ONE_DIM) : a.qHyperCube.qDimensionInfo.length > 1 && "grouped" === a.barGrouping.grouping ? (a.qHyperCube.qSize.qcy > v && (this._pagingMode = w.TWO_DIM, c = a.qHyperCube.qSize.qcy), this.components.dataArea._allowInnerSelection = a.qHyperCube.qDimensionInfo[0].qStateCounts.qOption + a.qHyperCube.qDimensionInfo[0].qStateCounts.qSelected <= 1) : a.qHyperCube.qDimensionInfo.length > 1 && (this.components.dataArea._allowInnerSelection = a.qHyperCube.qDimensionInfo[0].qStateCounts.qOption + a.qHyperCube.qDimensionInfo[0].qStateCounts.qSelected <= 1, c = this.isStacked ? a.qHyperCube.qStackedDataPages && a.qHyperCube.qStackedDataPages.length ? Math.max(a.qHyperCube.qDimensionInfo[0].qStateCounts.qOption + a.qHyperCube.qDimensionInfo[0].qStateCounts.qSelected, a.qHyperCube.qStackedDataPages[0].qData[0].qSubNodes.length) : a.qHyperCube.qDimensionInfo[0].qStateCounts.qOption + a.qHyperCube.qDimensionInfo[0].qStateCounts.qSelected : a.qHyperCube.qDataPages[0].qMatrix.length + a.qHyperCube.qDimensionInfo[0].qStateCounts.qOption + a.qHyperCube.qDimensionInfo[0].qStateCounts.qSelected, this._pagingMode = w.ONE_DIM), this.components.dimensionAxis.isDiscrete() || (this._pagingMode = w.NONE), this.components.dimensionAxis.setNumDiscreteUnits(c), this._super(a, b), this._readStoredData ? (this.components.dimensionAxis.setInnerOffset(d.axisInnerOffset), this.components.scrollArea.setOffset(d.scrollOffset)) : (this.components.dimensionAxis.setInnerOffset(0), this.components.scrollArea.setOffset(0)), this._checkPage = !0 }, updateDataArea : function (a) { this.components.dataArea.setShowDataPoints(a.dataPoint.showLabels), this.components.dataArea.setGroupingMode(a.barGrouping.grouping), this.components.miniChart && this.components.miniChart.components.dataArea.setGroupingMode(a.barGrouping.grouping), this.components.dataArea.updateNow(["properties"]) }, updateAxis : function (c, e) { var f, g, h, i, j, k, l, m, n, o, p, q, r, t = c.qHyperCube.qMeasureInfo.filter(function (a) { return !isNaN(a.qMin) }).map(function (a) { return { min : a.qMin, max : a.qMax, index : c.qHyperCube.qMeasureInfo.indexOf(a) } }); n = t.reduce(function (a, b) { return a.min < b.min ? a : b }, t[0]), o = t.reduce(function (a, b) { return a.max > b.max ? a : b }, t[0]), p = n ? n.min : u, q = o ? o.max : u, b.isNumeric(p) || (p = 0), b.isNumeric(q) || (q = 1), f = this.components.measureAxis, g = this.components.dimensionAxis, h = this.components.dimensionAxisTitle; var v = this.components.dataArea.getMajorAxisData(), w = this.components.dataArea.getMinorAxisData(); g.setDataRange(v.data, v.info), g.setGroupSize(v.groupSize), k = c.qHyperCube.qMeasureInfo.map(function (a) { return a.qFallbackTitle }).join(", "), l = c.qHyperCube.qDimensionInfo.map(function (a) { return a.qFallbackTitle }).join(", "), d.view !== d.Views.story ? (h.setTitle(l), h.showComponent()) : h.hideComponent(), a.extend(e.axes.measureAxis, { data : c.measureAxis, title : k, dataIndices : c.qHyperCube.qMeasureInfo.map(function (a, b) { return b }) }), a.extend(e.axes.dimensionAxis, { data : c.dimensionAxis, title : d.view !== d.Views.story ? "" : l, dataIndices : c.qHyperCube.qDimensionInfo.map(function (a, b) { return b }), currentDataIndices : [0] }), a.extend(e.axisTitles.dimensionAxisTitle, { data : c.dimensionAxis, title : d.view !== d.Views.story ? "" : l }), m = e.axes.measureAxis, r = this.getAxisOptions(m), e.refLineLabels.labels.axis = f, s.apply(this, [g, h, f, this.components.scrollArea, c, this._orientation]), this._super(c, e); for (j in e.axes) i = e.axes[j], i.component.setDataIndices(i.dataIndices || [i.dataIndex || 0]), i.component.setCurrentDataIndices(i.currentDataIndices || i.dataIndices || [i.dataIndex || 0]); p > q ? (q = 10, p = -10) : p === q && 0 === q && (q = 10, p = -10), q = Math.max(0, q), p = Math.min(0, p), n && o ? (this._cutMode = this.getSpikeSettings(c, n, o, p, q, r), q = this._cutMode.max, p = this._cutMode.min) : this._cutMode = { positive : !1, negative : !1 }, w ? this.setAxisDataRange(f, w.max, w.min, r.max, r.min, 1) : this.setAxisDataRange(f, q, p, r.max, r.min, 1), g.setUnitAlignment("none" === c.measureAxis.show ? "center" : ["near", "far"].contains(c.measureAxis.dock) ? g.isHorizontal() ? c.measureAxis.dock : "near" === c.measureAxis.dock ? "far" : "near" : g.isHorizontal() ? "left" === c.measureAxis.dock ? "near" : "far" : "bottom" === c.measureAxis.dock ? "far" : "near") }, getSpikeSettings : function (a, b, c, d, e, f) { for (var g, h, i = 0, j = 0, k = 0, l = 0, m = !1, n = !1, o = c.index + a.qHyperCube.qDimensionInfo.length, p = b.index + a.qHyperCube.qDimensionInfo.length, q = a.qHyperCube.qDataPages[0] ? a.qHyperCube.qDataPages[0].qMatrix : [], r = 0; r < q.length; r++) g = q[r], h = g[o].qNum, 0 >= h || isNaN(h) || (g[0].qIsOtherCell || g[1].qIsOtherCell ? k = Math.max(h, k) : i = Math.max(h, i), h = g[p].qNum, h >= 0 || (g[0].qIsOtherCell || g[1].qIsOtherCell ? l = Math.min(h, l) : j = Math.min(h, j))); return this.isStacked && a.qHyperCube.qMeasureInfo.length + a.qHyperCube.qDimensionInfo.length > 2 || (null !== f.max && f.max < e ? m = f.max > 0 : i > 0 && k / i > 5 ? (e = i, m = e >= 0) : 0 === i && k > 10 && (e = 1, m = e >= 0), null !== f.min && f.min > d ? n = f.min < 0 : 0 > j && l / j > 5 ? (d = j, n = 0 > d) : 0 === j && -10 > l && (d = -1, n = 0 > d)), { max : e, min : d, positive : m, negative : n } }, release : function () { this._super() }, setOrientation : function (a) { this._orientation = a || "horizontal" }, getOrientation : function () { return this._orientation }, getContextMenu : function (a, b) { var c = a.model; d.state === d.States.edit && (a.isReadonly || b.addItem({ translation : "contextMenu.flip" }).Activated.bind(function () { c.getProperties().then(function (a) { a.orientation = "horizontal" === a.orientation ? "vertical" : "horizontal", c.save() }) })) } }), { type : "barchart", BackendApi : o, template : q, View : t, definition : g, initialProperties : { version : .96, qHyperCubeDef : { qDimensions : [], qMeasures : [], qMode : "S", qPseudoDimPos : 1e4, qAlwaysFullyExpanded : !0, qInitialDataFetch : [{ qTop : 0, qHeight : v, qLeft : 0, qWidth : 17 } ], qSuppressZero : !1, qSuppressMissing : !0 } }, snapshot : { canTakeSnapshot : !0 }, options : { selections : { dataArea : {}, tooltip : {}, range : {}, legend : {} } }, importProperties : function (a, b, c) { var d = r.axisChart.importProperties.apply(r, [a, b, c]), e = d.qProperty; return e.qHyperCubeDef.qDimensions.length > 1 && "stacked" === e.barGrouping.grouping && (e.qHyperCubeDef.qMode = "K"), d } .bind(r), exportProperties : r.axisChart.exportProperties.bind(r) } }) - In workbench, select your custom extension project's JavaScript file, delete all content, paste the code you've just copied to your clipboard and modify the first line as follows:
This simply removes the characters ""extensions.qliktech/barchart/barchart" and replaces the characters "text!./barchart.ng.html" with "text!extensions.qliktech/barchart/barchart.ng.html" as the barchart.ng.html template is only local to the original built-in bar chart, not local to our custom bar chart extension.define(["jquery", "util", "qvangular", "client.utils/state", "general.utils/property-resolver", "extensions.qliktech/barchart/bararea", "extensions.qliktech/barchart/barchart-properties", "objects.views/charts/scrollable-chart", "objects.views/charts/components/chart-component", "objects.views/charts/components/grid", "objects.views/charts/components/axis/discrete-axis", "objects.views/charts/representation/combo-color-map", "objects.views/charts/utils/binding", "objects.views/charts/chart-data-helper", "objects.backend-api/pivot-api", "objects.utils/shapes/rect", "text!extensions.qliktech/barchart/barchart.ng.html", "objects.extension/object-conversion"], function (a, b, c, d, e, f, g, h, i, j, k, l, m, n, o, p, q, r) { - Don't forget to edit your project's QEXT file and specify a unique name for your extension such as "My bar chart".
- That's it, you should now be able to use this extension in your app. When you do, it should look exactly like the built-in bar chart but you now have it under your control to tweak as you wish.
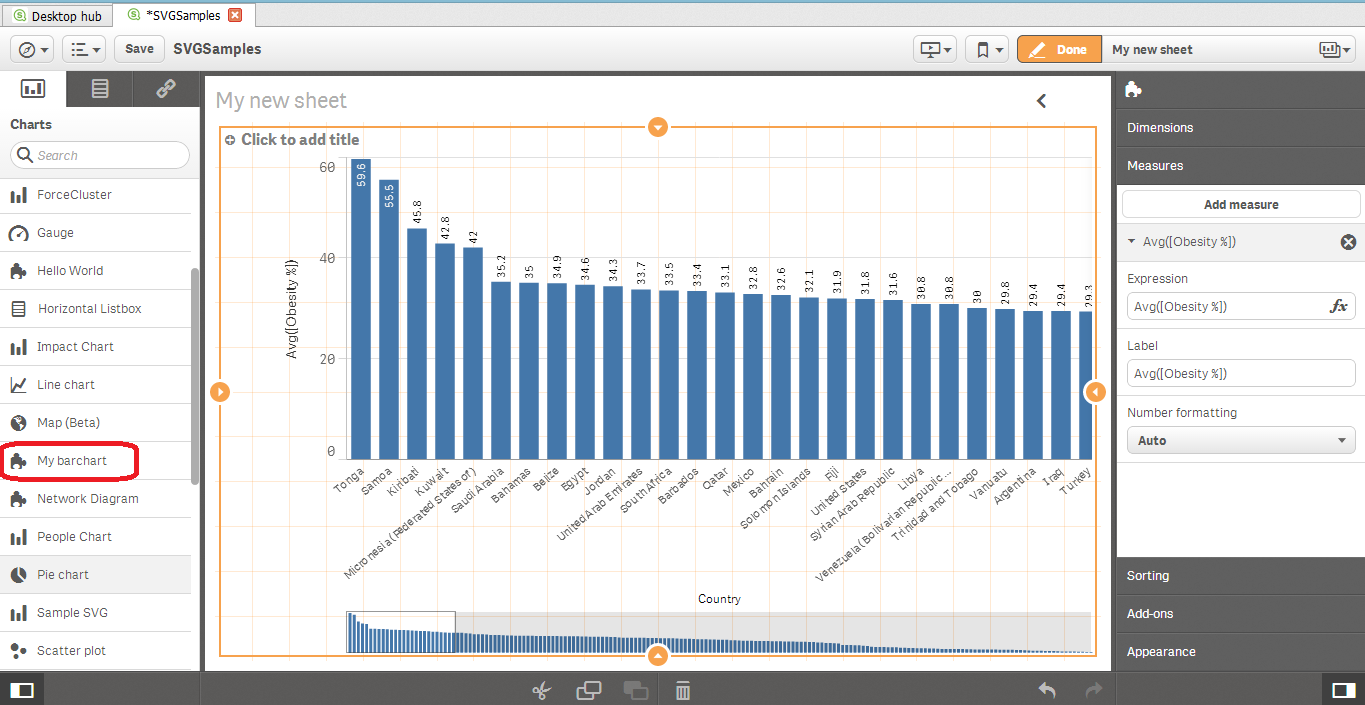
An extension based on the built-in bar chart
Showing posts with label extension. Show all posts
Showing posts with label extension. Show all posts
Wednesday, 10 September 2014
Extending built-in Qlik Sense visualisations
Visualisations built into Qlik Sense Desktop (such as the bar chart) are built on the same principle as visualisation extensions created in Workbench.This is great news as it means that there should be a way to extend built-in visualisations rather than having to build your own version of, say, the bar chart from scratch. To find out how to do this, let's fire up our trusty Fiddler (see my previous post for more details on Fiddler) and follow the steps below.
Monday, 8 September 2014
Porting d3.js visualisations to Qlik Sense
You may be aware that the JavaScript framework d3.js puts stunning visualisations at hand's reach of HTML5 practitioners and Qlik Sense developers willing to give it a go. I highly recommend you to visit d3js.org if you haven't yet done so and have fun browsing the interactive gallery. My guess is that a quick glance at the gallery will trigger within you a strong desire to port d3.js visualisations to Qlik Sense (just for fun if anything). If so, you're in luck as I'm just about to show you a quick example using Qlik Sense Desktop in a few easy steps.
- Install Qlik Sense Desktop
- Launch the Qlik Sense Desktop application
- Open Workbench, the Qlik Sense extension editor, by pointing your browser to "http://localhost:4848/workbencheditor/". You should see something like this:
Qlik Sense's Workbench - Find an interesting visualisation on d3.js such as this one entitled Cluster Force Layout IV (Credit to Mike Bostock at http://bl.ocks.org/mbostock) which I'll base this example on.
- View the source of the page at http://bl.ocks.org/mbostock/raw/7882658/ to reveal the JavaScript code. You do this by right-clicking the page with your browser and selecting "View page source" (I use Google Chrome). You should now see something like this:

Visualisation source code - Create a new extension project in the Workbench by selecting the "New" button. Name the extension "ForceCluster" and select "chart-template". Workbench will automatically create a JavaScript file and a QEXT file. The JavaScript file is responsible for behaviour and rendering and the QEXT file simply holds metadata about your extension such as name, version and author.
- Copy everything within the script tag in the page source (shown in the above screenshot) and paste it in the body of the paint function. The first few lines of the paint function should be as follows:
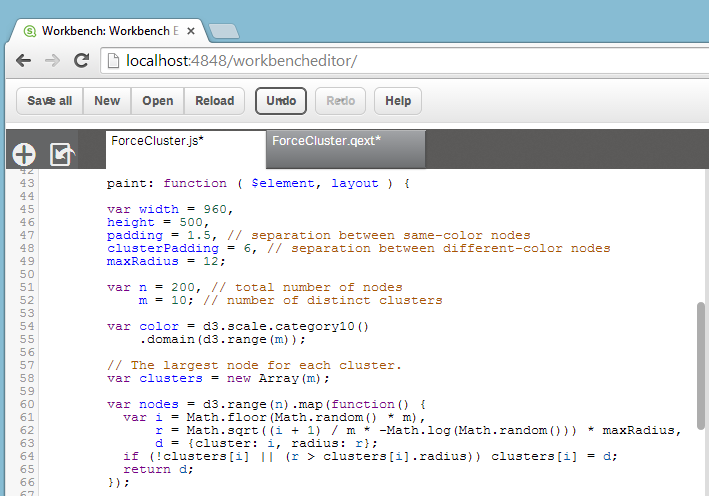
Altered paint function - Now we need to apply a slight tweak to the code so that the d3.js framework can find the extension object in the page. To do so, search for the following line:
and replace it with:var svg = d3.select("body").append("svg") .attr("width", width) .attr("height", height);
(Credit to Speros for his post entitled "Tutorial: How to Build a Qlik Sense Extension with D3" at http://blog.axc.net/?p=1617)// Chart object width var width = $element.width(); // Chart object height var height = $element.height(); // Chart object id var id = "container_" + layout.qInfo.qId; // Check to see if the chart element has already been created if (document.getElementById(id)) { // if it has been created, empty its contents so we can redraw it $("#" + id).empty(); } else { // if it hasn't been created, create it with the appropiate id and size $element.append($('<div />').attr("id", id).width(width).height(height)); } var svg = d3.select("#" + id).append("svg") .attr("width", width) .attr("height", height); - Select "Save all" in the Workbench toolbar.
- As we're porting a d3.js visualisation we'll need to import the d3.js framework so Qlik Sense Desktop can find it. Point your browser to http://d3js.org/d3.v3.min.js and save the page as d3.v3.min.js somewhere locally.
- Now import the JavaScript file into your extension project by selecting the "Import Asset" button (
 ) situated in the top left hand area of Workbench and browsing to the file you've just saved.
- Finally in the first line of the ForceCluster.js file replace the following characters:
with["jquery"]
This is so the d3.js framework can be referenced within our JavaScript code.["jquery", "extensions/ForceCluster/d3.v3.min"] - Your animated visualisation should now be ready to use. In Qlik Sense desktop create a new app, then a new sheet, edit the latter and drag the "ForceCluster" chart from the chart toolbar on the left hand-side onto the design area. Assuming that you set up a data source for your app, select a dimension and a measure (these won't actually be used in this example, I'll cover that in a future post).

Resulting interactive visualisation
Thank you for reading, this was a very simple first example to get you started. Eventually, of course you'd want to be able to bind the visualisation to some real data loaded in Qlik Sense, add labels and make selections. More on all that in another post.
Credits:
Credits:
- Mike Bostock at http://bl.ocks.org/mbostock for his amazing work with d3.js.
- Speros for his post entitled "Tutorial: How to Build a Qlik Sense Extension with D3" at http://blog.axc.net/?p=1617.
Subscribe to:
Posts (Atom)